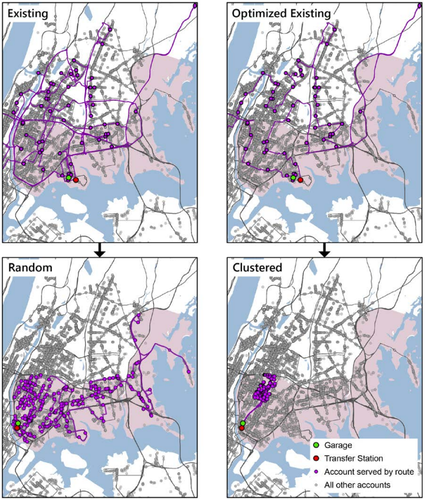
New York City Department of Sanitation- Private Carting VMT Analysis, New York City, NY
The goal of the project for the truck routing analysis was to quantify the extent of the annual vehicle miles traveled (VMT) by the private carting industry today and to compare that with a hypothetical exclusive zone collection system. The analysis focused on the 90 carters that pick up recyclable and putrescible waste. Data on the existing customers, carters, and the trucks routes were provided by Business Integrity Commission (BIC) and analyzed using ArcGIS software, Excel, and Python.
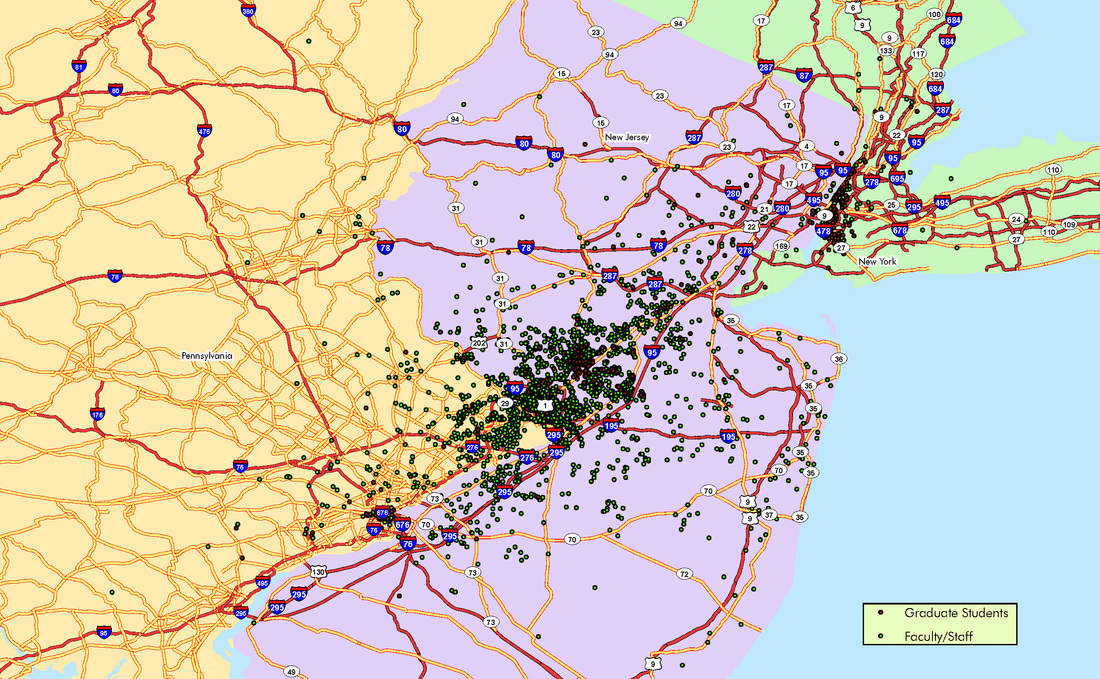
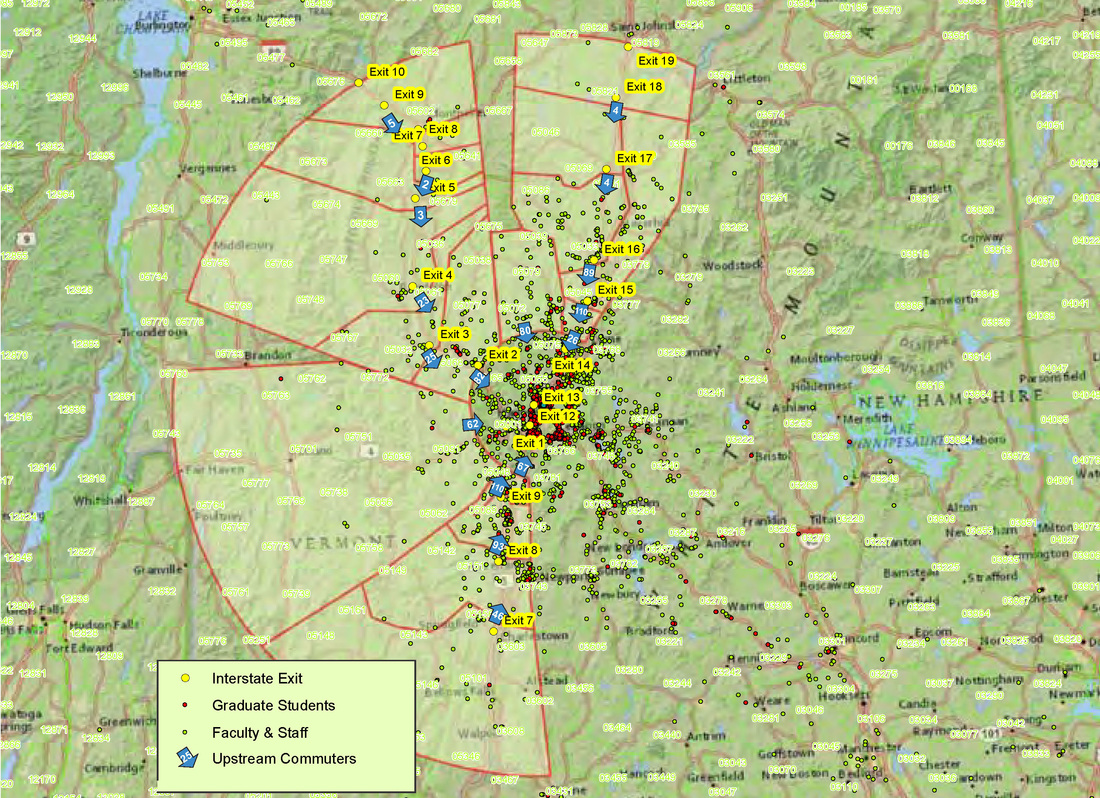
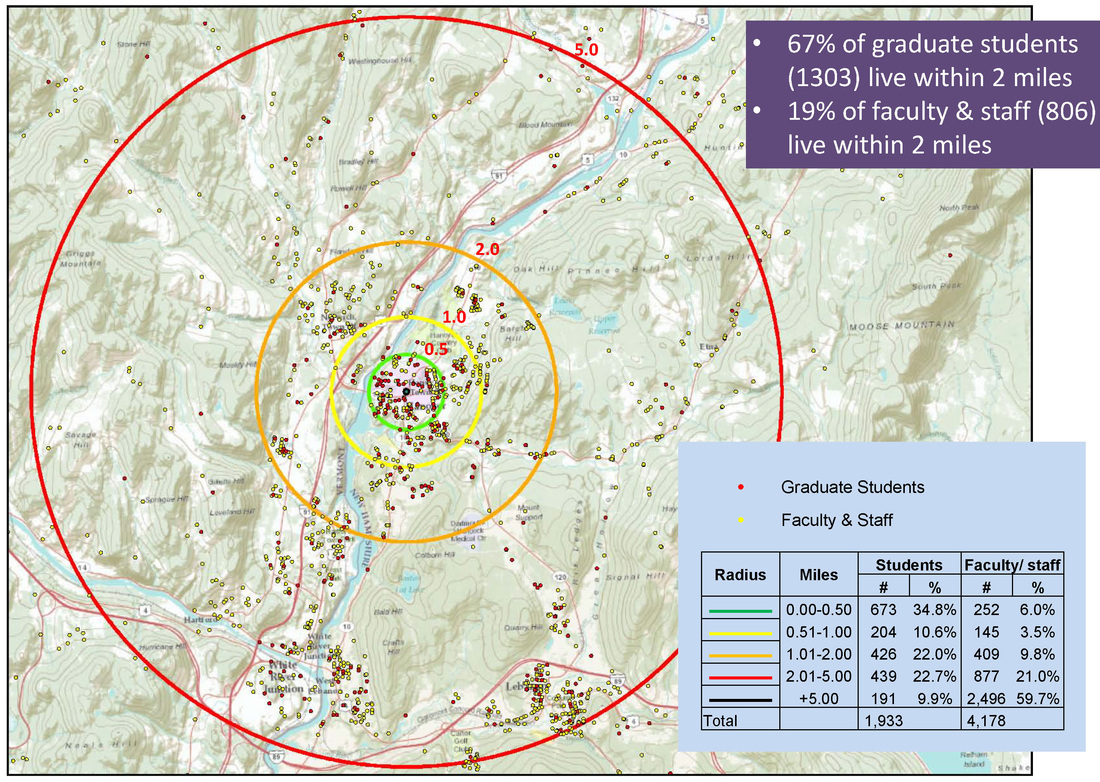
Dartmouth College Traffic and Parking- Potential Ride-Share Lots, Hanover, NH
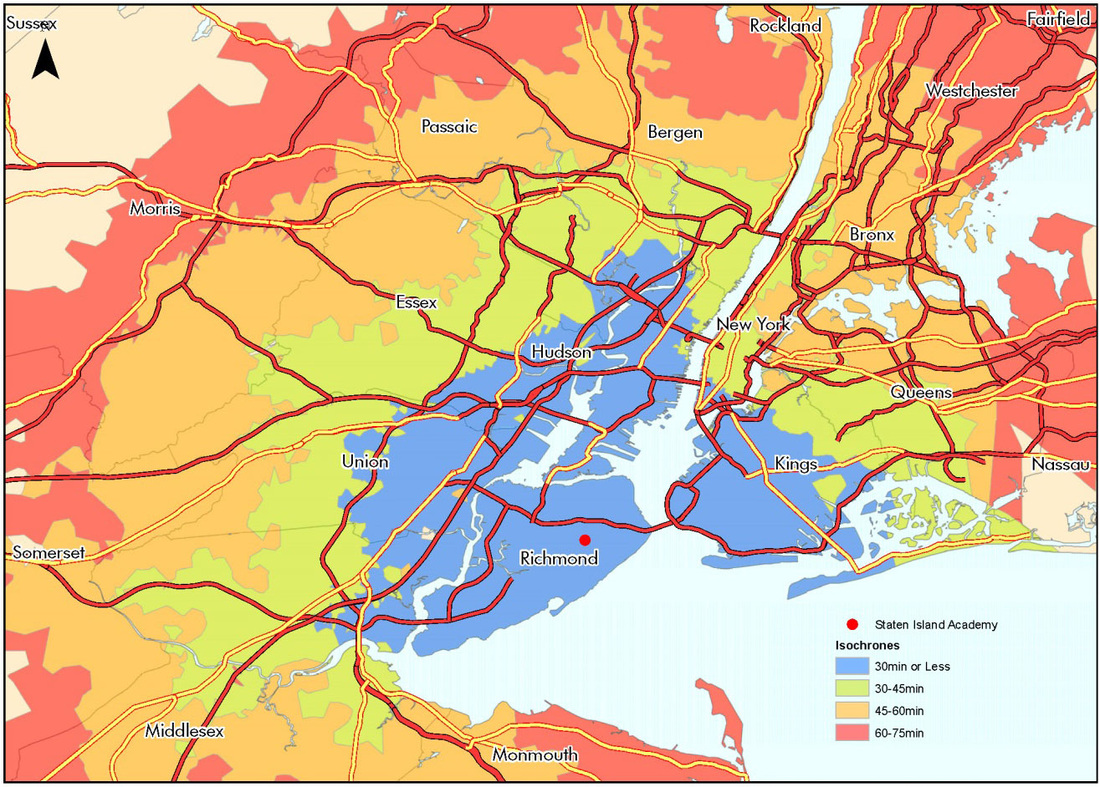
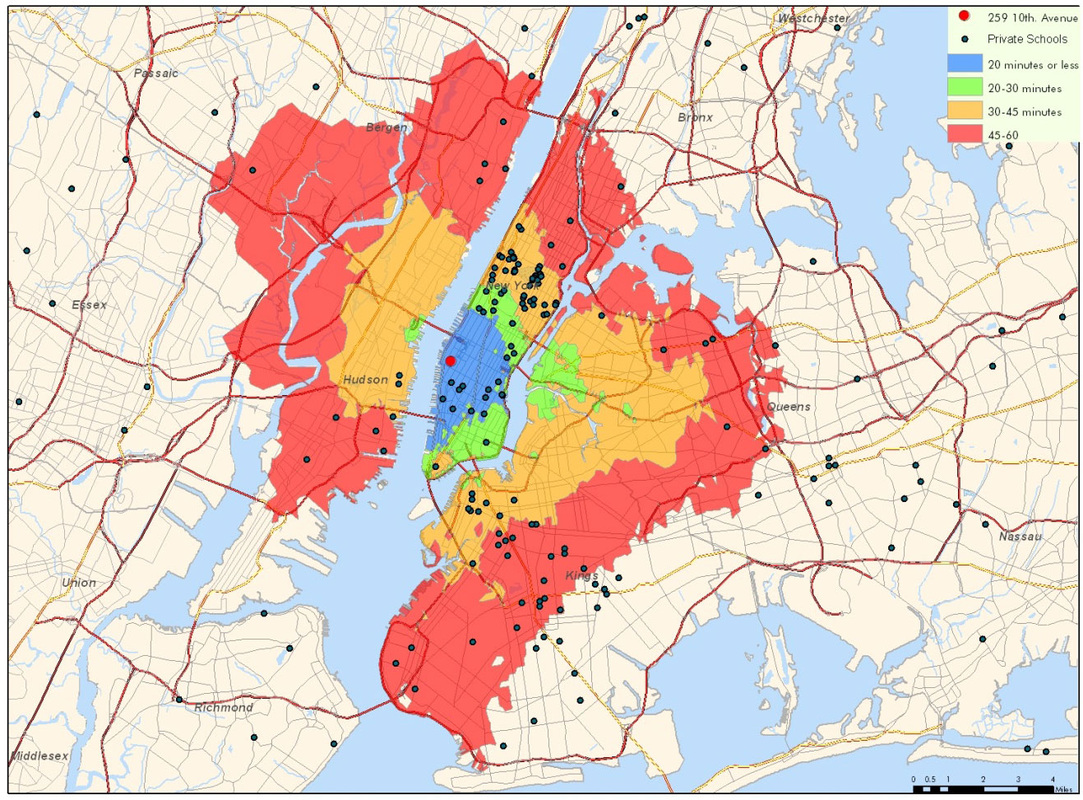
Speed Study, Staten Island, NY and New York, NY
Driving Time Analysis
Isochrones or travel time contours are represented as lines connecting all equal travel times to a certain point. The base information including road network data and average travel speed per road segments were developed by using the New York Metropolitan Transportation Council (NYMTC) Best Practice Model and the New Jersey Transportation Planning Authority (NJTPA) transportation model. This database covers the New York City Metropolitan area including parts of states of New York, New Jersey and Connecticut. We performed the analysis during the morning peak hour which was more critical for the project purpose.
The rest of the analysis to create the isochrones was completed using RouteFinder software for ArcGIS.